# A tibble: 14 × 8
   variable     mean     sd       q5     q95  rhat ess_bulk ess_tail
   <chr>       <dbl>  <dbl>    <dbl>   <dbl> <dbl>    <dbl>    <dbl>
 1 gm[1]    -3.86    0.578  -4.90    -3.01    1.01     507.    1469.
 2 gm[2]    -2.25    0.184  -2.56    -1.95    1.01     503.    1086.
 3 gm[3]    -0.587   0.169  -0.862   -0.305   1.00    1230.    1824.
 4 gm[4]     0.317   0.0838  0.176    0.450   1.00    1247.    2078.
 5 gm[5]     2.05    0.0941  1.89     2.20    1.00    1753.    2557.
 6 gm[6]    -0.0192  0.0281 -0.0647   0.0269  1.00    2392.    2904.
 7 gm[7]    -0.00908 0.0140 -0.0322   0.0141  1.00    2748.    3355.
 8 tau_u[1]  2.18    0.363   1.65     2.83    1.00    1609.    2404.
 9 tau_u[2]  1.06    0.131   0.866    1.30    1.01     559.    1599.
10 tau_u[3]  1.02    0.125   0.831    1.24    1.01     962.    1869.
11 tau_u[4]  0.469   0.0729  0.354    0.592   1.00    1231.    2422.
12 tau_u[5]  0.640   0.0716  0.534    0.769   1.00    1846.    2629.
13 tau_u[6]  0.115   0.0301  0.0658   0.165   1.01     842.     708.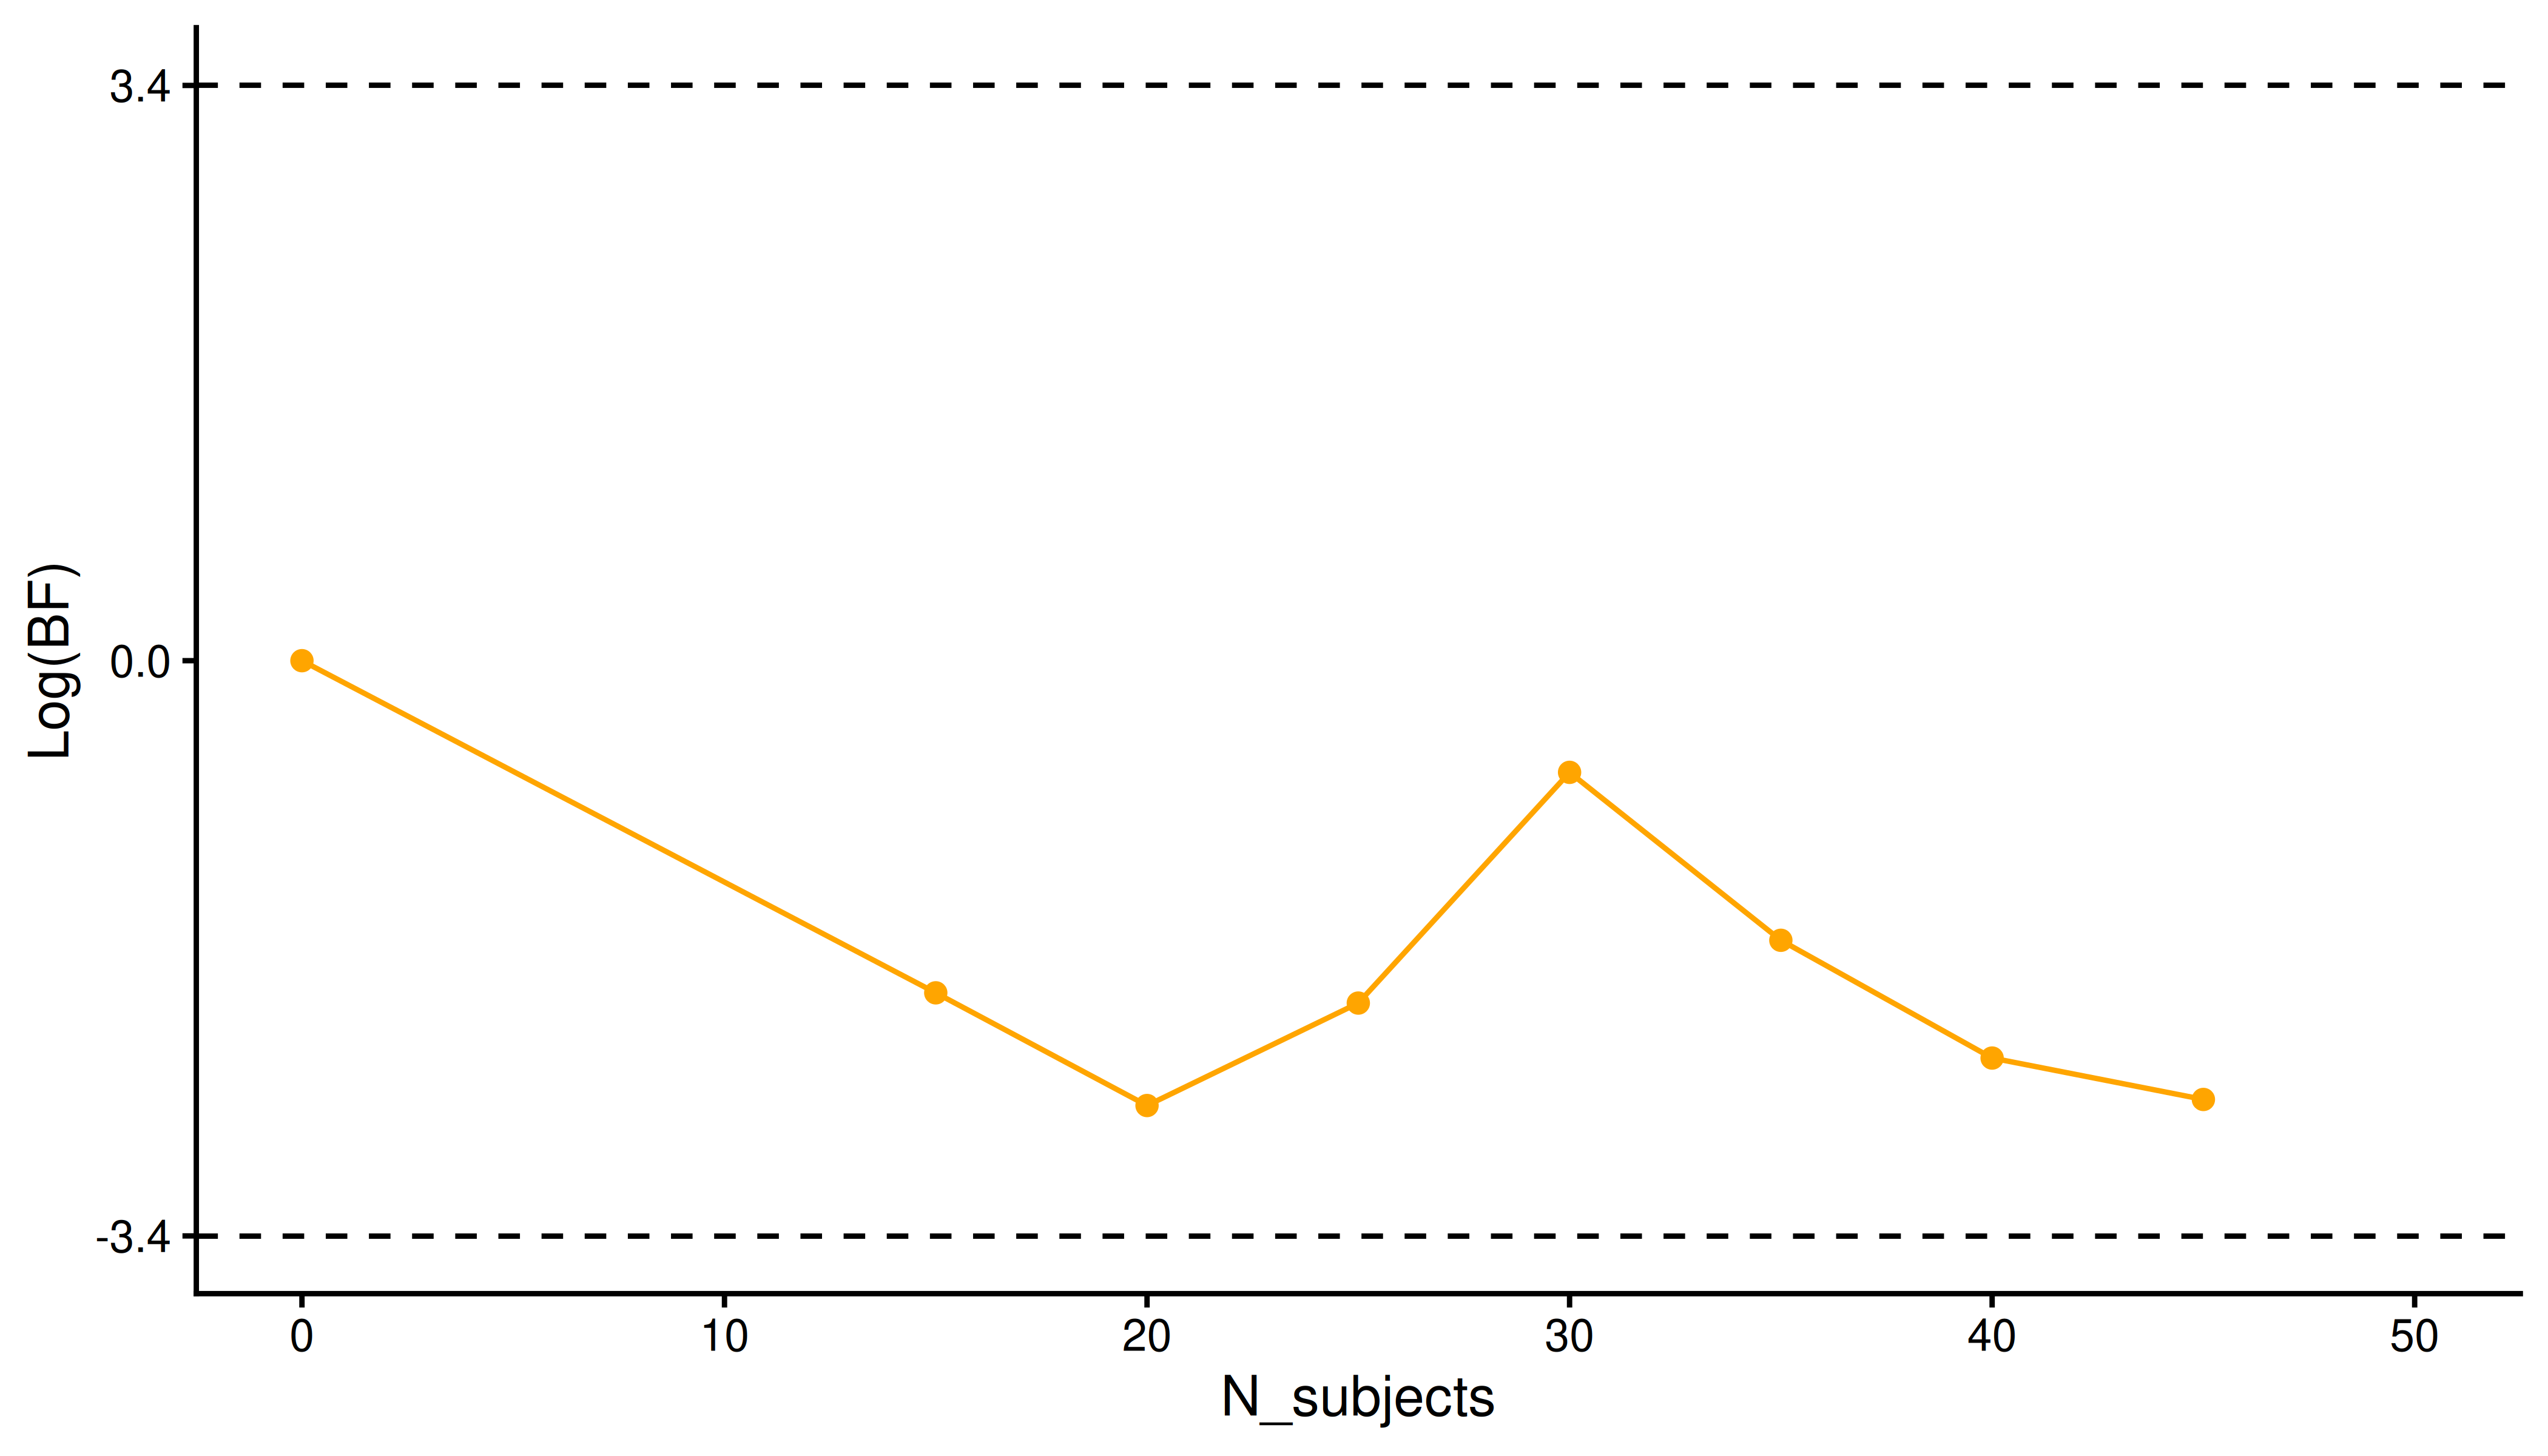
14 tau_u[7] 0.0375 0.0188 0.00585 0.0690 1.01 686. 1072.4 Part 4: Sequential Sampling Data Collection Progress
4.1 Overview
This section provides live updates on the sequential sampling experiment data collection. As participants complete the experiment.
4.2 Data Collection Status
At the moment there has been excluded 4, due to poor accuracy, and 0, due to no-response rates above. This in total means we have excluded 4.
4.3 Model convergence and Sequential sampling
$num_divergent
[1] 0 0 0 0

$num_max_treedepth
[1] 0 0 0 0

$ebfmi
[1] 0.7489507 0.7426296 0.7278653 0.6947601